Earnings - and dividend yields as of 26 November 2012
Based on the closing price of the S&P 500 index of 1,406.29 on 26 November 2012 and data from Professor Robert Shiller's home page, the current 10-year earnings- and dividend yields for the S&P 500 index are as follows (please refer to the June 2012 analysis for background information):

The earnings yield and the dividend yield increased 3.53% and 3.41% respectively from that reported on 4 October. This was mainly caused by the S&P 500 index decreasing 3.08%. Since the previous report, the data applied in this analysis has been extended from 1991 to 1978 to attain a longer perspective. The current earnings yield is 20.5% lower than the historical average since 1978 while the dividend yield is 31.06% lower. The two combined therefore indicate the current market valuation of the S&P 500 is higher than average.
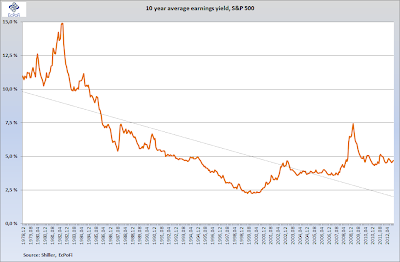


On balance, the S&P 500 index is more expensive than average based on earnings- and dividend yields. Furthermore, if the earnings yields for the period 1998 to 2000 (3 years), a period when the market valuation of the S&P 500 index was high, are removed from the data set, the current earnings yield of 4.69% is 24.72% lower than the adjusted average earnings yield of 6.23%. If the same adjustment is done for the dividend yield, the current dividend yield of 1.82% is 34.53% lower than the adjusted historical average of 2.78%. Purely based on average earnings- and dividend yields, adjusted and unadjusted, the S&P 500 index at its current level is substantially more expensive than average. However, based on the current high spread between the earnings yield and interest rates, driven by the latter, the S&P 500 index is substantially cheaper than average.
In conclusion, the current market valuation of the S&P 500 is high compared to historical averages, but with the current low level of interest rates this is perhaps understandable. And there have also been many periods when the index has achieved a higher market valuation than is the case today. But there have certainly been, and probably will be, better opportunities for the long term investor to go long the S&P 500 index. The current low level of interest rates is a significant driver of the current market valuation. But with a growing federal debt burden, artificially low interest rates driven by Fed policy and significant increases in money supply, there is a limit to how long interest rates can remain this low. And when they start to increase, the spread between the earnings yield and interest rates will be reduced, and the index will look even less attractive as an investment.
Based on the closing price of the S&P 500 index of 1,406.29 on 26 November 2012 and data from Professor Robert Shiller's home page, the current 10-year earnings- and dividend yields for the S&P 500 index are as follows (please refer to the June 2012 analysis for background information):


The spread (the difference between earnings yield and interest rate) increased mainly as a result of the price decrease of the S&P 500 index, increasing from 2.81% at the beginning of October to 2.99%. The spread remains considerable higher than the average negative spread of 1.01% since 1978. One (of many) likely reason for this, as previously reported, is that bond yields are artificially low due to the support from the Fed. In a historical perspective, the spread indicates the current market valuation of the S&P 500 index is lower than average.


On balance, the S&P 500 index is more expensive than average based on earnings- and dividend yields. Furthermore, if the earnings yields for the period 1998 to 2000 (3 years), a period when the market valuation of the S&P 500 index was high, are removed from the data set, the current earnings yield of 4.69% is 24.72% lower than the adjusted average earnings yield of 6.23%. If the same adjustment is done for the dividend yield, the current dividend yield of 1.82% is 34.53% lower than the adjusted historical average of 2.78%. Purely based on average earnings- and dividend yields, adjusted and unadjusted, the S&P 500 index at its current level is substantially more expensive than average. However, based on the current high spread between the earnings yield and interest rates, driven by the latter, the S&P 500 index is substantially cheaper than average.
In conclusion, the current market valuation of the S&P 500 is high compared to historical averages, but with the current low level of interest rates this is perhaps understandable. And there have also been many periods when the index has achieved a higher market valuation than is the case today. But there have certainly been, and probably will be, better opportunities for the long term investor to go long the S&P 500 index. The current low level of interest rates is a significant driver of the current market valuation. But with a growing federal debt burden, artificially low interest rates driven by Fed policy and significant increases in money supply, there is a limit to how long interest rates can remain this low. And when they start to increase, the spread between the earnings yield and interest rates will be reduced, and the index will look even less attractive as an investment.
No comments:
Post a Comment