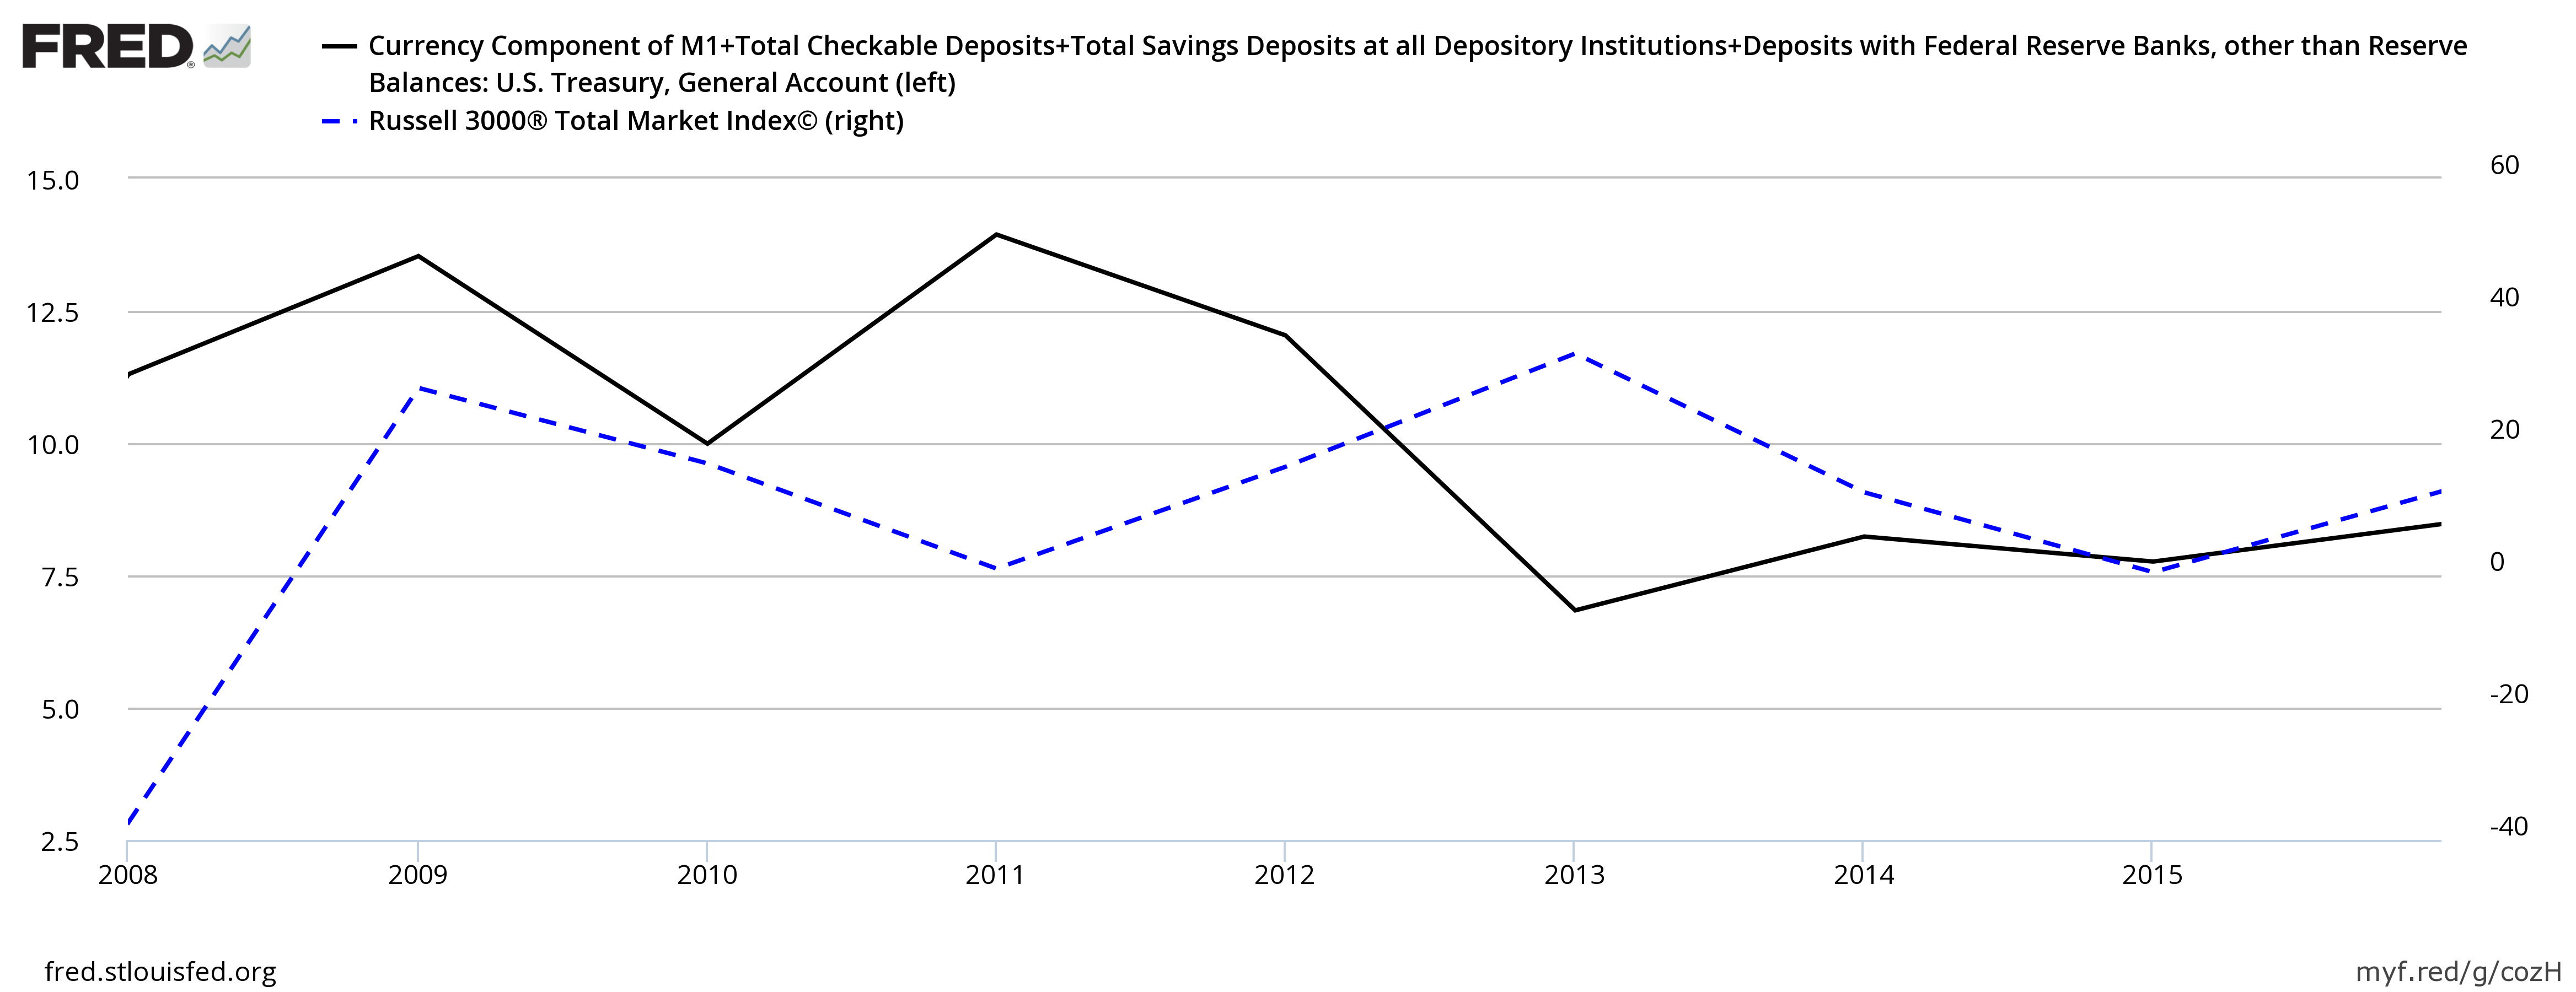
The U.S. stock market, as represented by the Russell 3000 Total Market Index, has now increased for eight consecutive years on a year-end basis. This is unprecedented based on data starting in 1980. But, since broad stock market gains over time are primarily a result of monetary inflation and as the quantity of money has more than doubled since the end of 2008, it is no surprise that the stock market today is higher than eight years ago.
The U.S. Money Supply and the Stock Market, y/y % change
FRED® Graphs ©Federal
Reserve Bank of St. Louis. 2017. All rights reserved. All FRED® Graphs appear
courtesy of Federal Reserve Bank of St. Louis. https://fred.stlouisfed.org/, FTSE Russell
It is surprising however that there has been no major stock market correction to speak of during this eight-year bull market. After all, economic theory does tell us that economic booms must be followed by busts. This boom-bust cycle is not however due to some inherent feature of a capitalistic system, but is instead caused by the elastic money supply implemented by government fiat (i.e. law, hence fiat money). In its essence, an elastic currency - money which can change in quantity to satisfy changes in demand - is capable of putting out of action the limits savings impose on the level of investments. When this link between savings and investments is broken the business cycle is unleashed.
Investment booms driven by an increase in the quantity of money rather than an increase in savings are therefore unsustainable. The boom must one day come to an end, frequently in the form of a crash in economic activity and stock market prices. The credit-driven investment booms that came to abrupt ends in the early 2000s and in 2007/08 are recent examples.
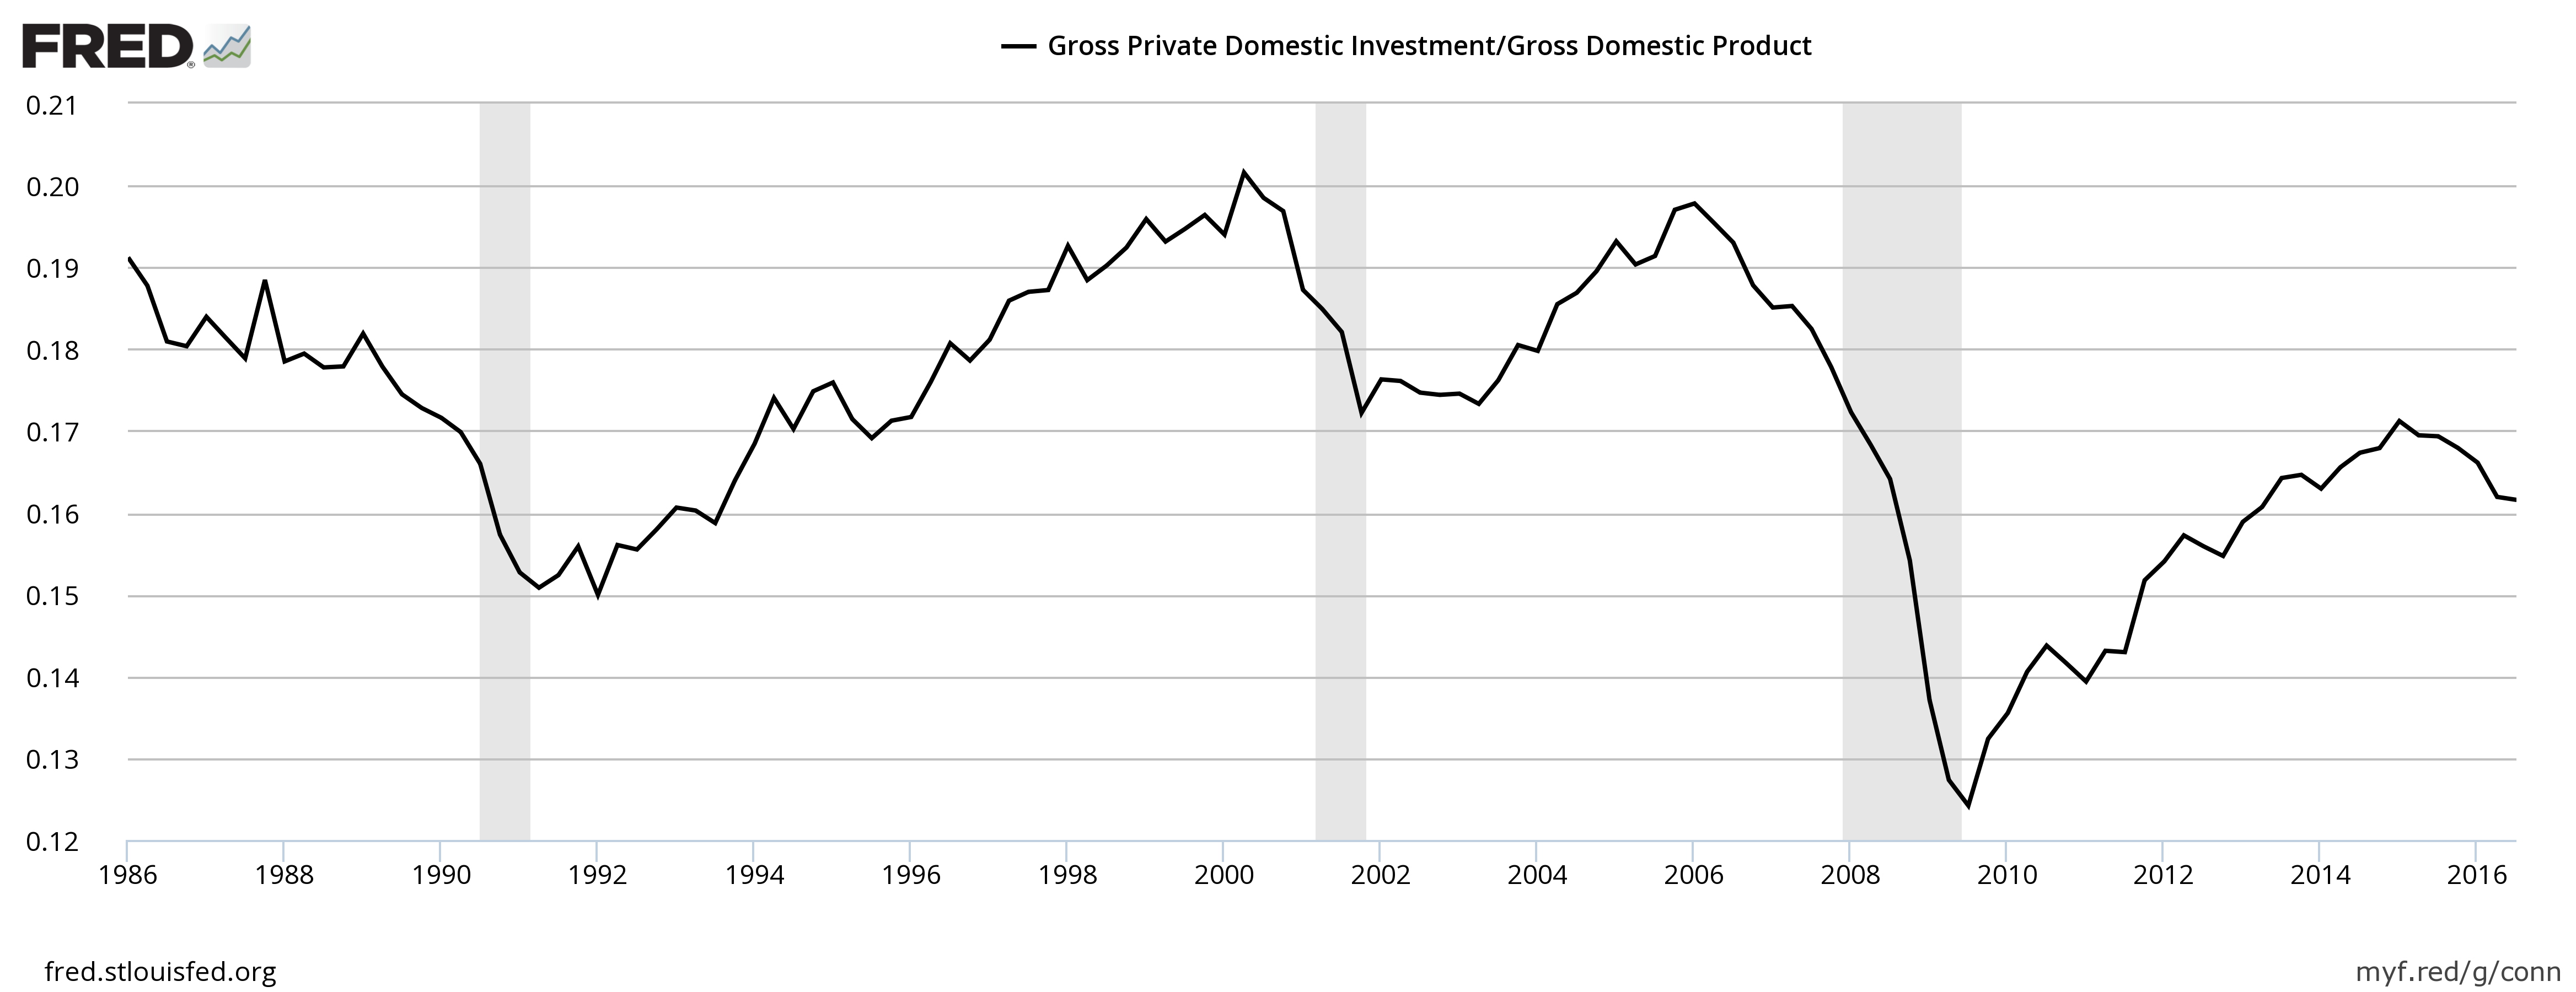
But something is different this time around in the U.S. compared to the previous two business cycles: there has been no wide-spread investment boom since the 2008 banking crisis even though monetary inflation has been significant ever since. This can clearly be seen in the relatively low ratios of the levels of investment compared to GDP...
Gross Private Domestic Investment / Nominal GDP
FRED® Graphs ©Federal
Reserve Bank of St. Louis. 2017. All rights reserved. All FRED® Graphs appear
courtesy of Federal Reserve Bank of St. Louis. https://fred.stlouisfed.org/
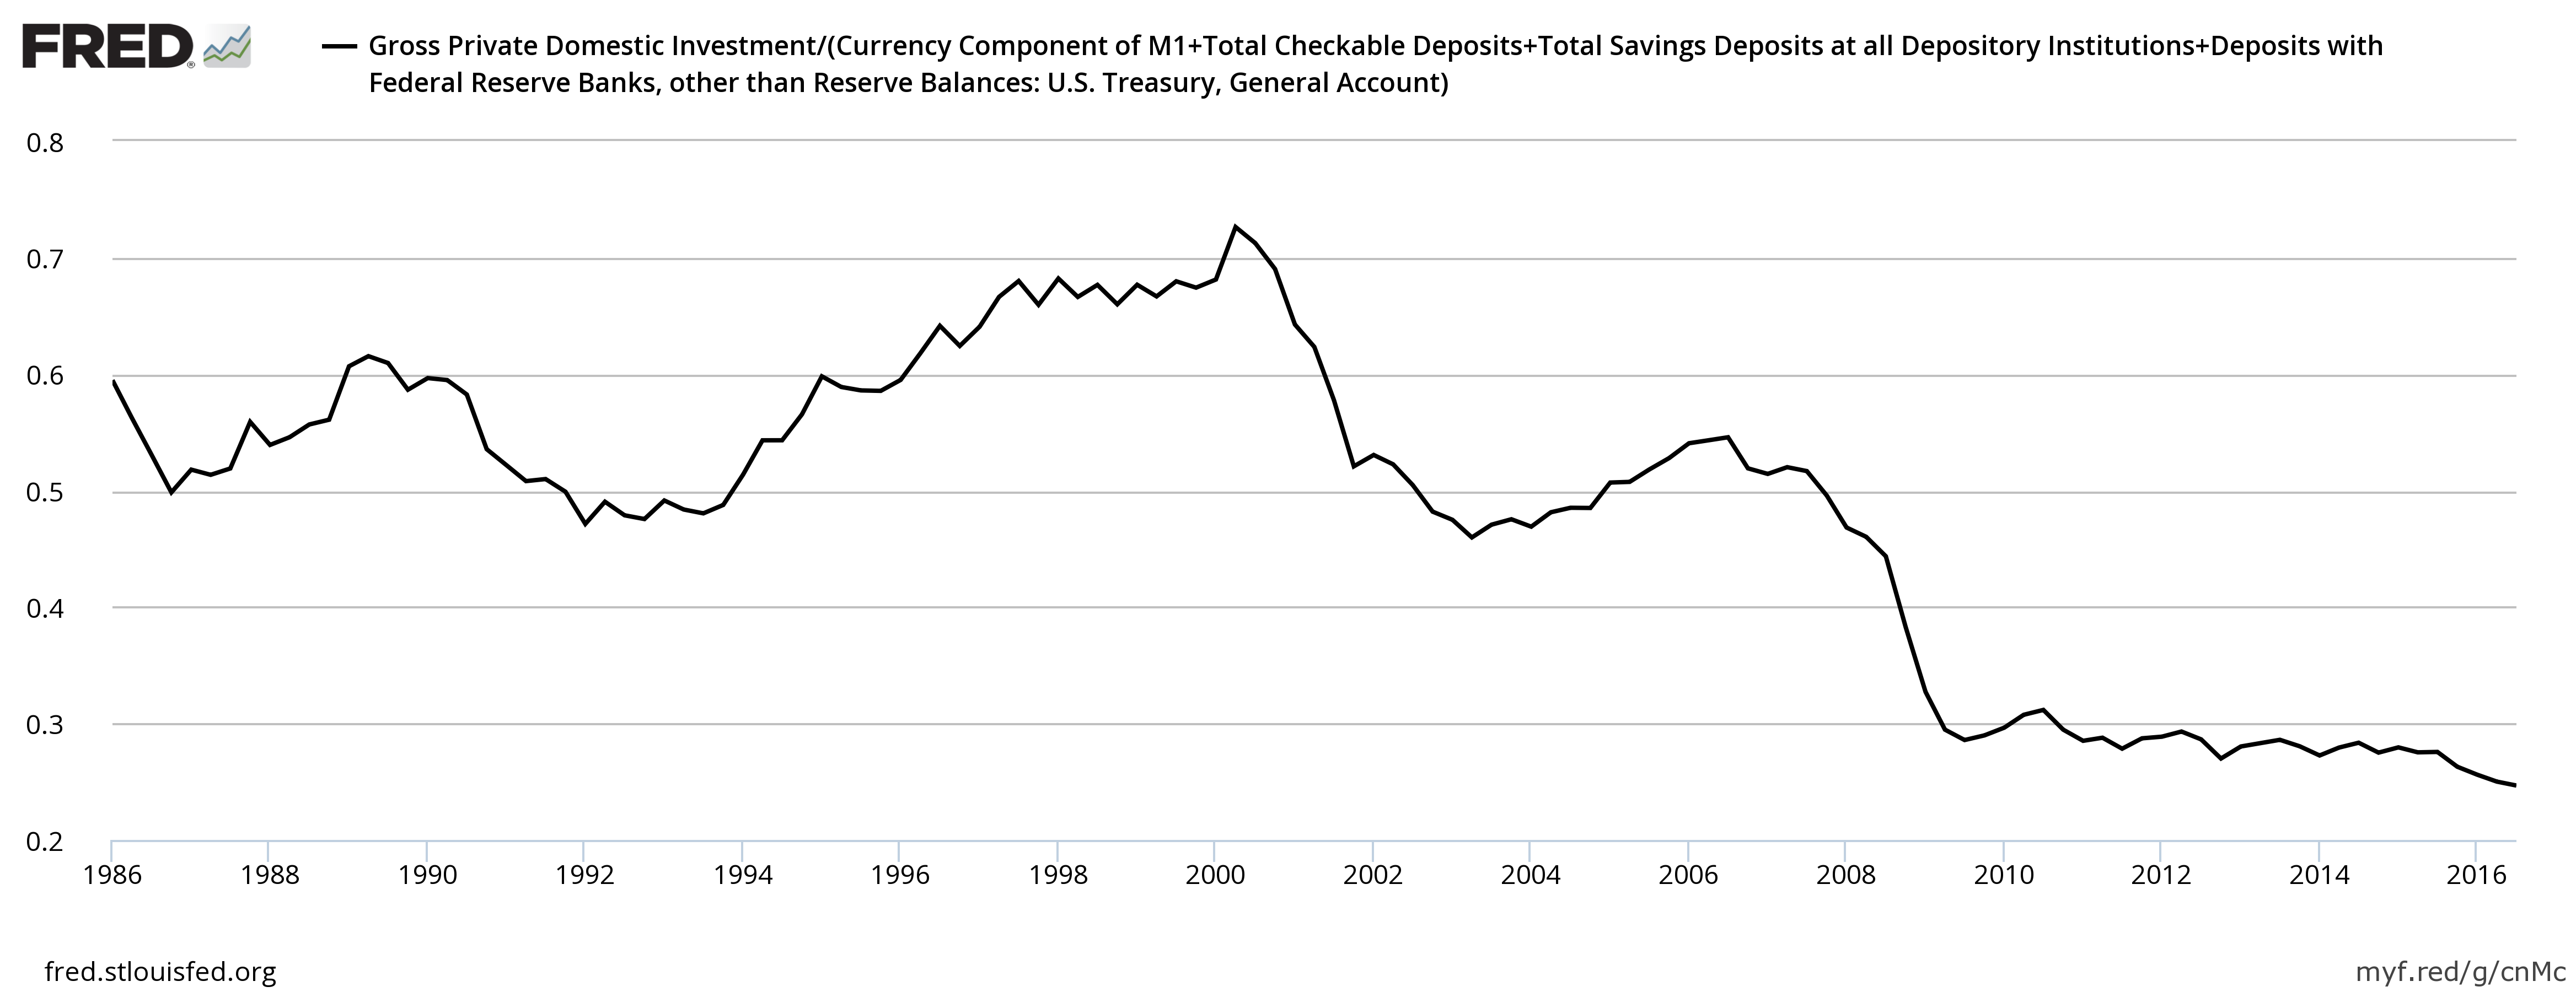
...and especially when compared with the money supply.
Gross Private Domestic Investment / Money Supply
FRED® Graphs ©Federal
Reserve Bank of St. Louis. 2017. All rights reserved. All FRED® Graphs appear
courtesy of Federal Reserve Bank of St. Louis. https://fred.stlouisfed.org/
Notice the uncharacteristically stable, but slightly declining ratio since 2009 in the chart above and how this contrasts the prior peaks and troughs in the ratio.
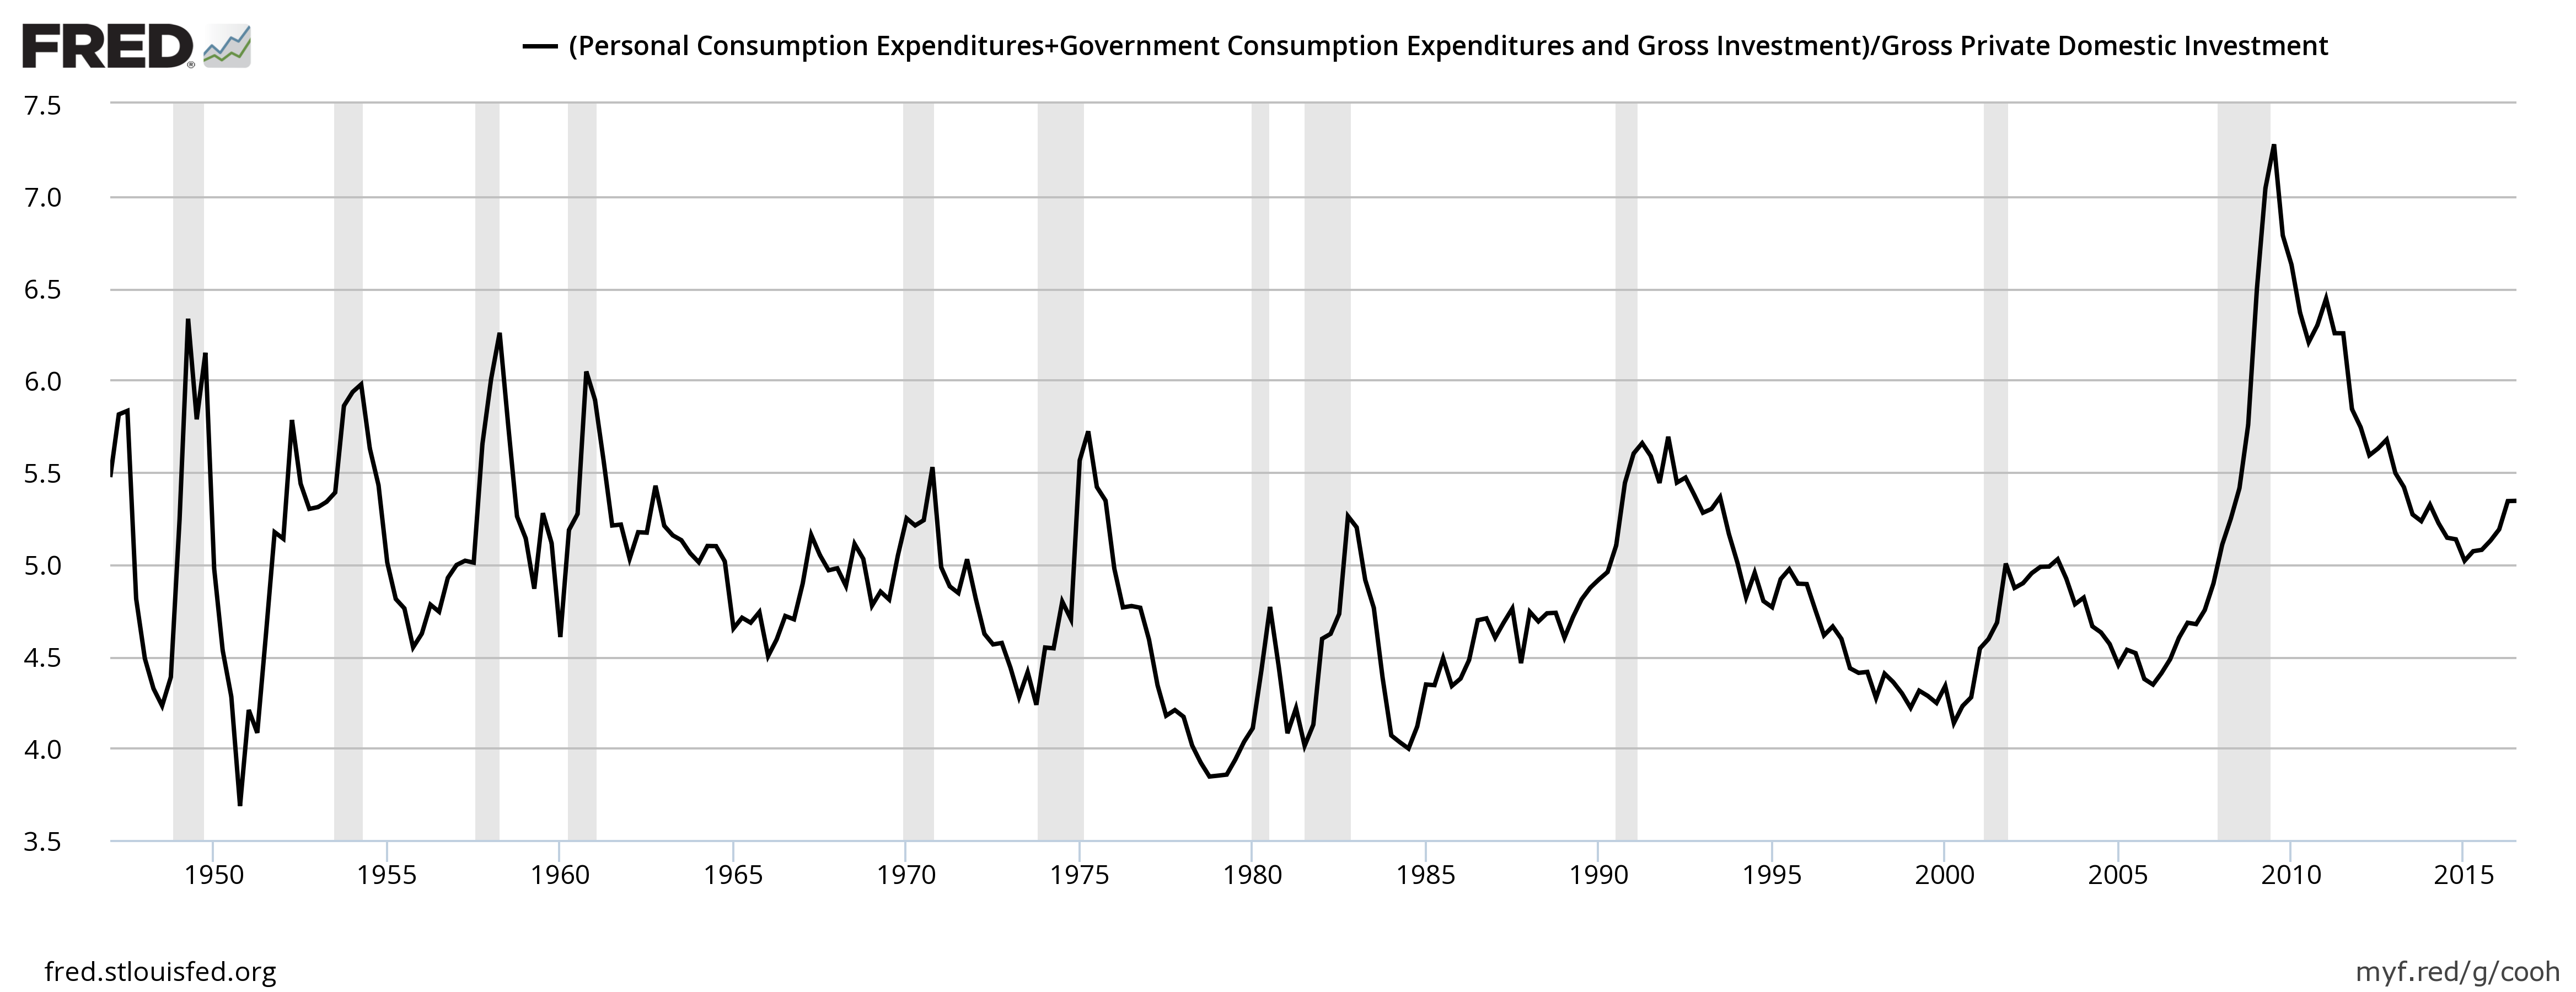
Since the saving rate remains relatively low in the U.S., the monetary inflation has supported consumption spending more than it has stimulated investments. ** This is shown in the chart below; since 2009, consumption spending has outpaced investments on a scale never before seen based on data since 1947.
Consumption Expenditures (private + government) / Gross Private Domestic Investment
FRED® Graphs ©Federal
Reserve Bank of St. Louis. 2017. All rights reserved. All FRED® Graphs appear
courtesy of Federal Reserve Bank of St. Louis. https://fred.stlouisfed.org/
The last eight years can hence be characterised as more of a money supply-driven consumption binge than a credit-driven investment boom. The relatively low levels of investments indicate the degree of malinvestments might be smaller during this cycle than was the case during the last two credit booms. If that is indeed the case, this would have had a dampening effect on the business cycle.
The relatively low level of investments may therefore have acted to soften the business cycle and hence prolong uninterrupted monetary expansion. Low levels of investments have arguably also reduced the pressure on market interest rates to rise significantly which is supportive of still further monetary inflation. Stocks of course have benefited greatly from the combined effect of money supply growth and low interest rates.
U.S. Money Supply / Bond Yield and the Stock Market
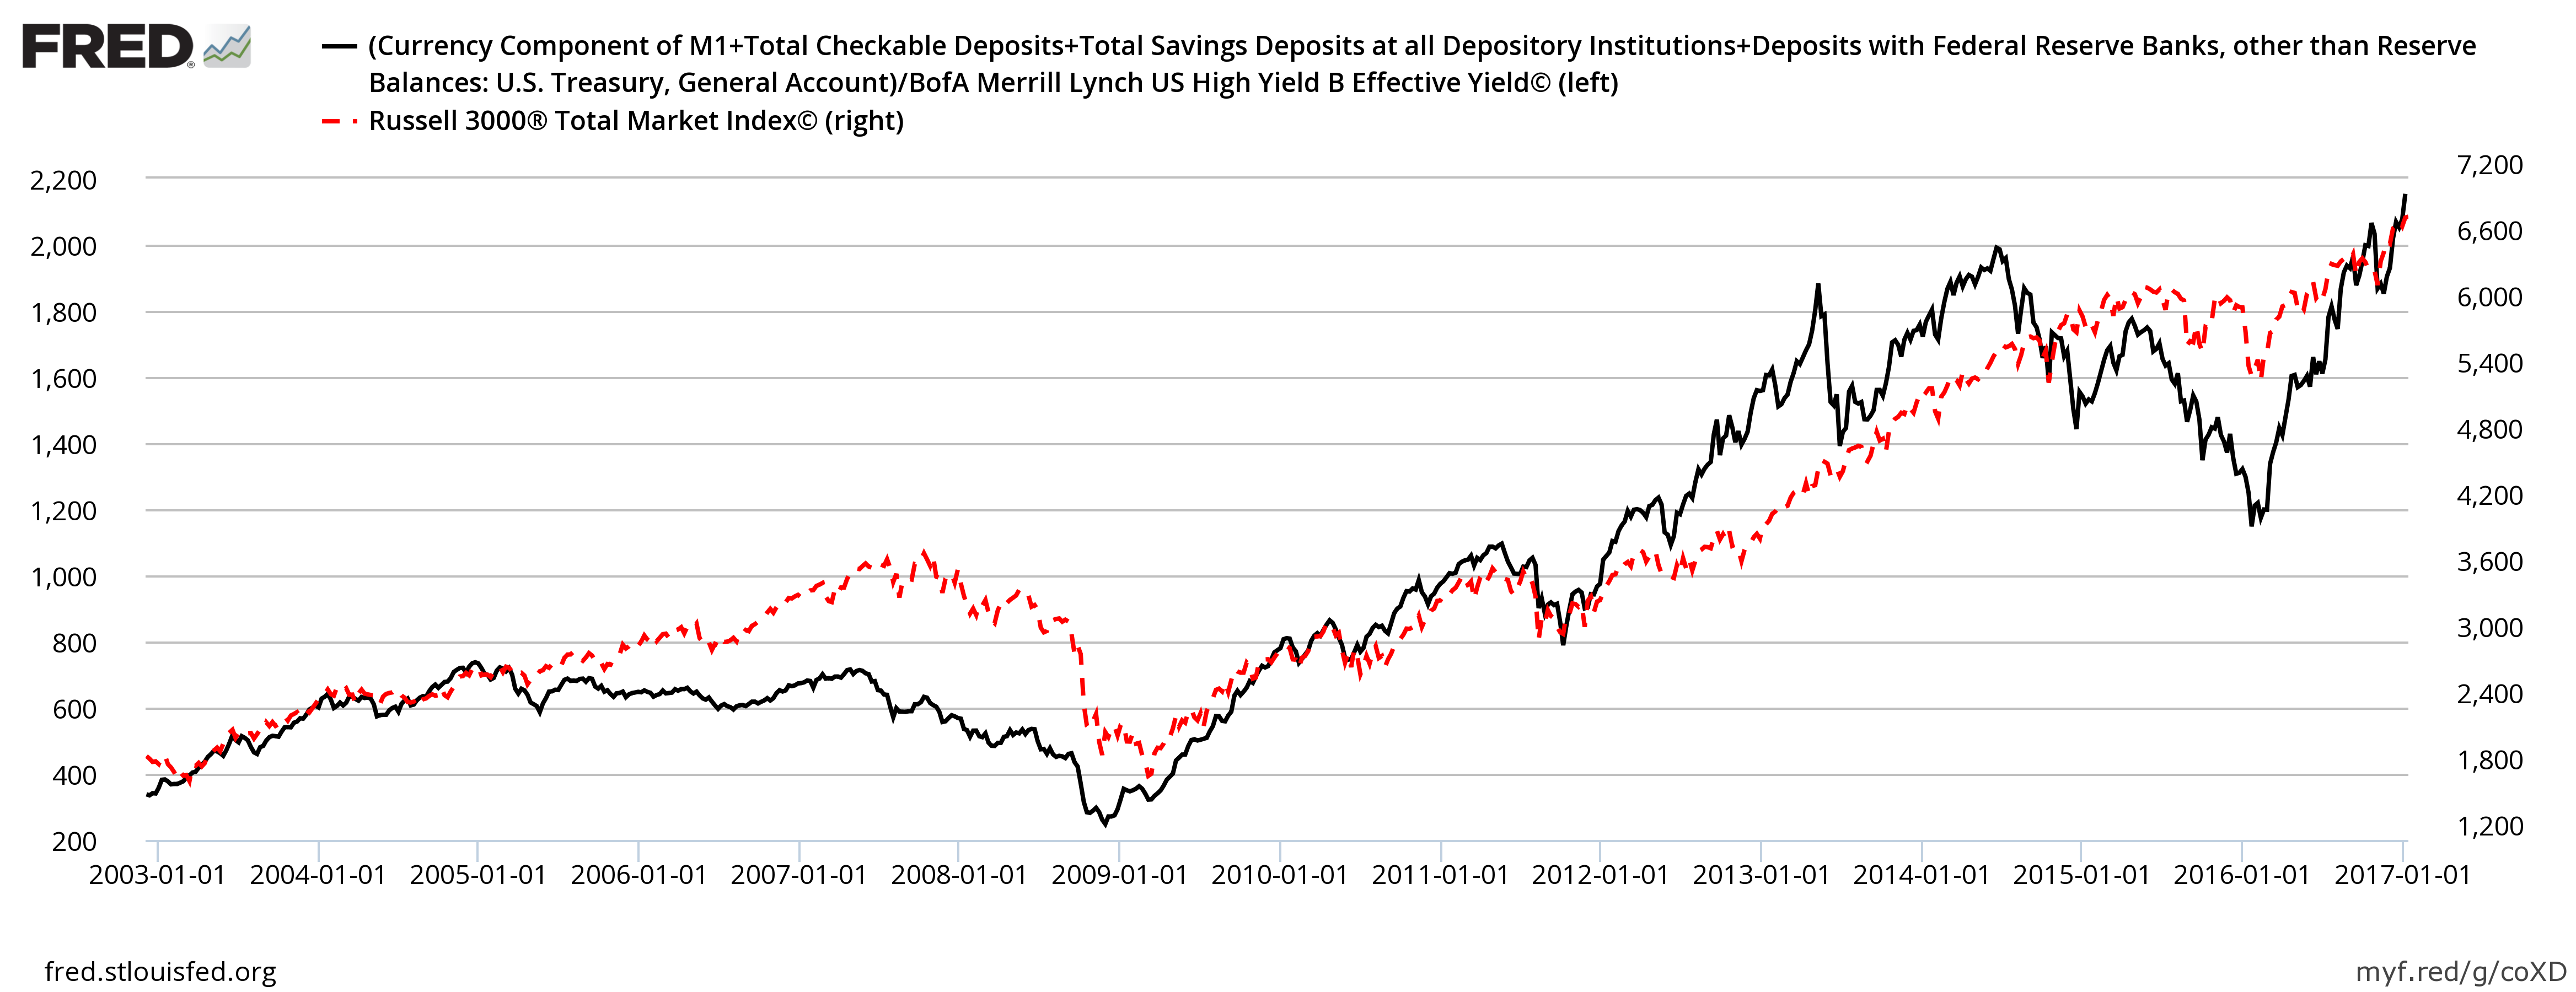
FRED® Graphs ©Federal
Reserve Bank of St. Louis. 2017. All rights reserved. All FRED® Graphs appear
courtesy of Federal Reserve Bank of St. Louis. https://fred.stlouisfed.org/, FTSE Russell, BofA Merrill Lynch
The developments described above may help explain the longevity of the U.S. bull market in stocks which started in March 2009. But, since increased consumption financed by debt (instead of increased production) also is unsustainable, it remains to be seen if the bull market survives another year. Watch that money supply!
* The average personal saving rate since 2009 is 6.0% compared to an average rate of 7.7% for 1973-2008.
No comments:
Post a Comment