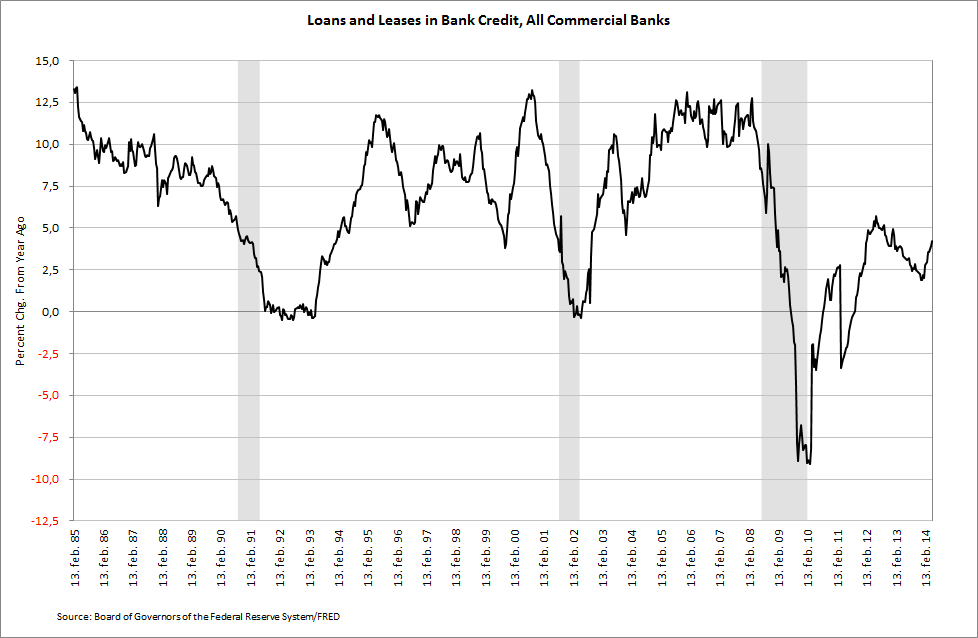
Since the end of last year, the M2 money supply has increased USD 158.8 billion. During the same period, the Loans & Leases portfolio of U.S. commercial banks increased USD 159.2 billion. Changes in money supply are not easily reconcilable, but this development suggests banks are once again playing a bigger role in creating new money. Loans & Leases have now increased 2.1% this year and 4.2% compared to the same week last year - the biggest year on year increase since the bi-weekly period ending 23 January 2013.
The driver of the growth in Loans & Leases this year is a rapid expansion in Commercial & Industrial Loans, making up 61.0% of the total growth. The rest of the growth in Loans & Leases is made up of Real Estate Loans (18.6% of the growth), Consumer Loans (a negative 3.6% of the growth) and Other Loans (24.1% of the growth). Compared to the same period last year, Commercial & Industrial Loans expanded 11.1%, the biggest increase since March last year and 2.35 times higher than the average year on year growth rate of 4.7% since 1985.
In short, the issuance of Commercial & Industrial Loans are once again booming and are now 6.0% higher than the peak from October 2008 and 42.7% than the trough from July 2010.
With U.S. banks holding more than USD 2.7 trillion in cash (most of which is excess cash), there is virtually no limit to how much credit banks can create given the low reserve requirements. Other factors, such as the demand for loans and banks' lending standards, will therefore determine the extent of the growth in bank lending going forward.
The M2 money supply expanded 6.3% for the week compared to the same period last year. The average year on year growth rate this year, currently at 6.0%, remains significantly lower than the 6.8% average last year and the 8.6% average in 2012. The growth rate has picked up though since hitting 4.9% in early January. Since bottoming at 1.1% at the end of last year, the year on year growth rate in Bank Credit has picked up ending on 3.5% for the bi-weekly period ending 14 May. This growth was driven by the increase in Loans & Leases discussed above.
The 10-year U.S. treasury yield dropped eight basis points for the bi-weekly period ending 23 May, while the 1-year yield fell one basis point. Year to date, the 10-year yield has shred a full 45 basis points, but is 55 basis points higher than at this stage last year. The spread between the two remains high in a historical perspective.
Key monetary statistics for the bi-weekly period ending 14 May 2014 (23 May for treasury yields):


