Showing posts with label U.S. Money Credit and Treasuries Review. Show all posts

Thursday, 7 September 2017

Highly Unusual Developments in the U.S. Money Supply

The numbers for the final week of August have just been released and they show a highly unusual development for being this late in the year: the money supply is actually lower today than at the beginning of the year. 


If this continues it will not be long until the year on year growth rate turns negative. More specifically, if the current trend continues the growth rate could plummet below zero - a development which has not taken place for more than 22 years - sometime in October, if not earlier. Even if it does not, the growth rate will nonetheless fall sharply in October compared to last year when it hit more than 12%.

Though there are leads and lags between changes in the money supply growth rate and stock market returns, October may look like a particularly dangerous month this year as the money supply growth rate has slowed more or less continuously and at great pace all year. Sooner or later money will become scarcer (and interest rates higher) and favoured over stocks forcing a stock market sell-off and a potential panic.

Also, the price deflationary pressures that will kick in may lead the Federal Reserve to abandon all talk of further potential interest hikes. In fact, it may have no other choice (given the misplaced "theories it operates under) than to implement the next round of QE (though it will be too late to avoid a stock market panic).

In other words, this is not the time to be long the U.S. stock market and other stock markets that correlate with it.


Related:

Ahoy! The U.S. Stock Market On Course To Crash


Tuesday, 9 December 2014

The Artificial U.S. Economic Recovery: QE is Finally Showing Up Directly in Bank Lending

As I've written about many times this year, during 2014 the role of money creator has shifted to banks from the Fed following the Fed taper and the ultimate completion of QE3 in October. Back in mid March I wrote,
It appears the recent increase in the M2 growth rate has been spurred by increases in Loans & Leases for the commercial banks (part of Bank Credit). Having bottomed at 1.7% in early January, the YoY growth rate has since increased to 2.82%, the highest recorded since mid October last year. It's of course to early to tell if banks have committed to expand lending. What we do know however is that in order to avoid a significant reduction in the money supply growth rate, banks this year will have to increase lending substantially especially if the Fed commits to further tapering. It will certainly not be excess reserves that hold back bank lending growth as it currently amount to more than US$ 2.5 trillion.
The banks have indeed increased lending substantially as it is currently up about 6.4% this year. This has spurred bank credit, which consists of loans and securities, to fatten by almost 6.4% as well. During the last four months, the banks' excess reserves created by QE1, 2 and 3 are now being used directly to expand bank credit. This is a new development. As the monetary base consists of bank reserves and currency, the monetary base has actually been declining since early August due to bank reserves being employed to increase bank credit. Since hitting a record high $4.1045 trillion on August 6 this year, the base has since declined a whopping 6.55%, or $268.8 billion.


Banks using their excess reserves to increase bank credit therefore explains why the money supply growth rate has held up reasonably well (see below) despite the Fed taper and the end of QE3. For now, I must admit there is little credence in my speculation that the Fed might actually implement a 100% reserve banking system. This comes as no great shock however as the end of inflationary policies will perhaps never be brought to an end by political design.

Compared to the same week last year, bank credit is now up 7.1% while the M2 money supply is up 5.9%.


The chart shows the money supply growth rate has been fairly flat in recent months and that bank credit growth has jumped to levels not seen since 2008. Bank credit growth has been driven by both an increase in the total value of securities owned by banks...


...and an increase in bank lending.


Breaking bank credit down further into the individual components that make up securities and lending, we can identify the key drivers of bank credit growth during the last twelve months,


The table shows that 34.3% of the growth in bank credit during the last twelve months has come from securities owned by banks while the rest, 65.7%, has come from increased lending. The issuance of more loans has hence been the key driver of bank credit growth, of which Commercial & Industrial (C&I) lending has been the biggest component.


Since peaking at $1.5975 trillion on 22 October 2008, C&I dropped to $1.1797 trillion on 28 July 2010. It has made a serious comeback this year however and at $1.7668 trillion, C&I is now 10.6% higher than it was in October 2008 and has expanded a significant 13.1% during the last year. Excluding the 2012/2013 period when the expansion represented an increase from a previous sharp drop in 2009/2010, the current aggressive growth rate in C&I was last seen during the run-up to the 2000 and 2008 credit booms that both ended badly. With bank reserves currently exceeding $2.5 trillion, most of which is classified as excess, low capital (10.7% equity to total asset ratio, just slightly higher than the 10.62% the week Lehman collapsed), qualified borrowers and uncertainty are some key factors restricting banks in expanding credit even faster. Without these restrictions, there would be virtually no limit to the extent banks can create credit and money given the extraordinary amount of  excess reserves.

So what does this lending driven increase in bank credit and the money supply do with the U.S. economy? It will do what it always does and what it did the last time around: create an artificial boom which will lead to a very real bust, just like 2008. What is different now however is that unsustainable government programs are substantially bigger than back then. On top of that, a lot of damage has already been done to asset prices (and other prices) by previous monetary expansion and artificially low interest rates fueled by the various QE programs over the last six years, appearing to many as an "economic recovery". But this (GDP) growth is artificial, driven by money supply growth. Not to mention the various business sectors that have artificially expanded as a result of the debt monetization of government deficit spending programs. All these distortions, in one way or another, depletes an economy's saving as money supply growth outpaces saving growth - real growth can only by driven by saving and investment.


The coming bust must therefore be much, much worse than the previous one as there is more damage and more distortions to be repaired and repaid this time around. The market always wins in the end, though it sometimes can take a very, very long time indeed before it does...

*****

Additional tables and charts


Related:

The Classic Boom Bust Cycle Continues, Rampant Business Lending In The U.S.

Tuesday, 5 August 2014

The Classic Boom Bust Cycle: Banks' Equity Ratios Near 2008 Levels as Growth in Lending Increases Further, Monetary Base Hits $4 Trillion

It's taken a tremendous amount of hard work by the busy treasury and mortgage-backed security traders at the New York Fed, but here we are: the U.S. monetary base a few days ago eased passed the perhaps not so magical US$4 trillion mark. Since week ending 10 September 2008, five days before the Lehman collapse, the monetary base has fattened by a stunning US$3.145 trillion, or 359% during the course of less than six years. 

The full article is published exclusively on Seeking Alpha. You can access the article here. 


The U.S. Money, Credit & Treasuries Review is a report issued on a bi-weekly basis by EcPoFi. You can access all previous issues since February 2013 here.


Related: 

Saturday, 19 July 2014

The Classic Boom Bust Cycle Continues, Rampant Business Lending In The U.S.

Further stock market gains are facing heavy headwinds in the U.S. as earnings growth is slowing and the Fed is indeed tapering (for now). The reach for yields driven by artificially low interest rates have rocketed many asset prices upwards to new all-time highs, some reaching spectacular highs (though some have slipped back a little in recent weeks).

The full article is published exclusively on Seeking Alpha which you can access here. 

Friday, 4 July 2014

Goodbye Fed (for now), Hello Banks: A Classic Boom Bust Cycle Now Being Added on Top of The Fed Bubble

Clearly, bank credit expansion cannot increase capital investment by one iota. Investment can still come only from savings.
Man, Economy, and State, Murray N. Rothbard 


U.S. Money, Credit & Treasuries Review (as of 25 June 2014)


On June 18th, the Fed decided to taper its monthly asset purchases further, from $45 billion a month to $35 billion starting July (my bold): 
The Committee currently judges that there is sufficient underlying strength in the broader economy to support ongoing improvement in labor market conditions. In light of the cumulative progress toward maximum employment and the improvement in the outlook for labor market conditions since the inception of the current asset purchase program, the Committee decided to make a further measured reduction in the pace of its asset purchases. Beginning in July, the Committee will add to its holdings of agency mortgage-backed securities at a pace of $15 billion per month rather than $20 billion per month, and will add to its holdings of longer-term Treasury securities at a pace of $20 billion per month rather than $25 billion per month. The Committee is maintaining its existing policy of reinvesting principal payments from its holdings of agency debt and agency mortgage-backed securities in agency mortgage-backed securities and of rolling over maturing Treasury securities at auction. The Committee's sizable and still-increasing holdings of longer-term securities should maintain downward pressure on longer-term interest rates, support mortgage markets, and help to make broader financial conditions more accommodative, which in turn should promote a stronger economic recovery and help to ensure that inflation, over time, is at the rate most consistent with the Committee's dual mandate. 
Since December last year, asset purchases has now been reduced by $50 billion a month, a decrease of 58.8%. As a result, combined with a higher base, the year on year growth rate of the monetary base is declining rapidly. At 24.2%, the growth rate is now a significant 15.2 percentage points lower than the 39.4% growth rate at the end of last year.


What repercussions will this tapering by the Fed have for the U.S. economy? 

Firstly, it could affect treasury yields. In 2013, the Fed bought $45 billion worth of longer-term treasury securities every month to help push down yields on government securities. During that year, the federal debt increased $919 billion, of which the Fed was the (end) buyer of about $540 billion, or just under 59% of the increase in debt. During the first half of 2014, the U.S. federal debt has been growing at a substantially slower pace in U.S. dollar terms compared to the first half last year; $306 billion increase from 31 December 2012 to 18 June 2013 vs $180 billion increase from 31 December 2013 to 18 June 2014. The Fed will have bought about $190 billion worth of longer-term treasuries as of June this year, which is more than the increase in federal debt (105.6% of the increase in debt to be exact). This helps explain why the Fed is indeed tapering: the need to monetize new debt is simply currently much smaller than it was last year. Therefore, at the current pace of both Fed purchases and increases in government debt, the Fed's role as the marginal buyer of treasuries is still intact and in this sense the tapering by itself should not push yields higher. 

Secondly, the tapering could affect the distribution of the newly created money, including its overall growth rate. Basically, the money supply increases through two main channels: banks issuing new loans and the banks and/or the Fed buying securities from parties other than banks. Last year illustrates this well: during the year, the M2 money supply increased by about $565 billion, of which banks created a modest (in a historical perspective) $115 billion, or about 20%. The rest of the increase in the quantity of money outstanding was made up largely of the U.S. government issuing treasuries with a bulk of these ending up on the books of the Fed as discussed above. As the Fed tapers, presumably in tandem with the U.S. government continuing to reduce its debt expansion, less new money is created in the process. This will first hurt those people and companies that have become accustomed to receiving the newly created money early, e.g. government contractors. How this process will go about is difficult to tell, but some sectors will be affected which will then again ripple through the economy and lead to changes in the distribution of money in one way or another. Also, unless banks compensate for this reduction in the money supply growth rate now being caused by the government and the Fed, the overall growth rate in the money supply could head downwards sharply and thereby bring the economy and the financial markets with it. As I've stated before, banks have indeed started to expand lending. More on this below. 

***

The M2 money supply growth rate compared to last year ended on 6.6% for the bi-weekly period ending 25 June, the highest since October last year and higher than the 6.3% average during the last 12 months. Bank Credit increased 4.6% on the same basis, up from a 4.0% growth rate two weeks ago and substantially higher than the 1.1% growth rate at the end of last year.


This substantial growth in bank credit, combined with an expanding growth rate of the money supply, suggests banks are indeed creating enough credit, and with it new money, to compensate for the reduction in the growth of government debt and the Fed taper.

During the last 12 months, bank credit expanded by about $475 billion, or 4.6%. Where did this growth come from? Bank credit consists of two main items; Securities and Loans & Leases. Of this $475 billion growth, about $91 billion (19.1%) was due to an expansion of Securities held by banks while the rest, $384 billion (80.9%), was from an increase in Loans & Leases.

As Loans & Leases consists of Commercial & Industrial Loans, Real Estate Loans, Consumer Loans and Other Loans, each category's share of bank credit growth during the last 12 months can be broken down as follows:


Loans & Leases, which currently makes up 73.3% of bank credit (securities makes up the rest, see table below), increased 5.1% compared to same period last year to record the highest growth rate for almost two years. Increased bank lending has therefore been the major driver of the bank credit expansion during the last 12 months...


...of which a 10.5% increase on last year in the issuance of Commercial & Industrial Loans has been the main driver, making up 43.3% of the growth in Loans & Leases (and 34.5% of bank credit growth) during the last 12 months. 


In short, the negative effect the reduced expansion of government debt and the Fed taper has on the money supply growth rate has been largely offset by a corresponding expansion of bank credit this year. Whether this will continue remains to be seen and will be monitored in this bi-weekly report going forward. This shift in how and where new money is generated will have implications for the structure of the economy. In the aftermath of the banking crisis in 2008 and 2009, the money supply expanded predominantly by way of deficit spending: the government issued debt (monetized partly by the Fed) and spent those money in the economy. The trend now is that the bulk of the new money is generated through the conventional channel, namely the banks, of which a bulk ends up directly with corporations that then spend these new money. As a result, those who previously received the new money first will now lose or gain less than they have in recent years in terms of spending power while the new receivers of the new money generated by banks will increase theirs.

Finally, with reserve balances, most of which classified as "excess reserves, approaching $2.7 trillion, banks are in a position to greatly increase lending (ignoring other constraints such as qualified borrowers and the demand for credit). As they now appear to be doing just that, not from prior savings but from issuing new money (Cash Assets at banks are still increasing even as lending grows) the U.S. economy is now well on its way to discover the full force of the classic meaning of the Austrian Business Cycle Theory: an increase in the quantity of money generated by bank lending to corporations. If the growth in bank credit fueled by a growth in lending not backed by a commensurate amount of prior savings continues to push the money supply growth rate up, another artificial boom could be on its way. Perhaps that is what the U.S. stock market has noticed, or is anticipating, as it keeps hitting new record highs again this week. If that turns out to indeed be the case, the economy is now building up to a spectacular bust (even worse than the one which has been in the pipeline for years) which will make the previous one look like a walk in the park. Why? Because this time the U.S. government is seriously indebted to which can be added that the U.S. economy is much more dependent on government spending now than some six years ago. Also, bank balance sheets are no more solid now than pre Lehman: on 10 September 2008 the equity to total asset ratio for all U.S. commercial banks was 10.62%. Today it is 10.89%. Yes, banks hold a lot more cash this time, both in total and as a percent of total assets. But with the Fed always ready to bail out banks, it perhaps makes little difference if bank assets consists of mostly cash or treasuries (or MBSs) exchangeable for cash immediately at the sign of liquidity problems.

***

Key U.S. monetary statistics as of 25 June 2014 (treasury yields as of 2 July 2014):


Tuesday, 10 June 2014

Buoyant Growth in Bank Loans Gradually Replacing QE as The Driver of U.S. Money Supply Growth

If in the course of our investigation, it is possible to prove that the rate of interest charged by the banks to their borrowers is not promptly adjusted to all changes in the economic data (as it would be if the volume of money in circulation were constant)— either because the supply of bank credit is, within certain limits, fundamentally independent of changes in the supply of savings, or because the banks have no particular interest in keeping the supply of bank credit in equilibrium with the supply of savings and because it is, in any case, impossible for them to do so—then we shall have proved that, under the existing credit organization, monetary fluctuations must inevitably occur and must represent an immanent feature of our economic system—a feature deserving of the closest examination.
Prices and Production, Friedrich A. Hayek 


U.S. Money, Credit & Treasuries Review (as of 28 May 2014)

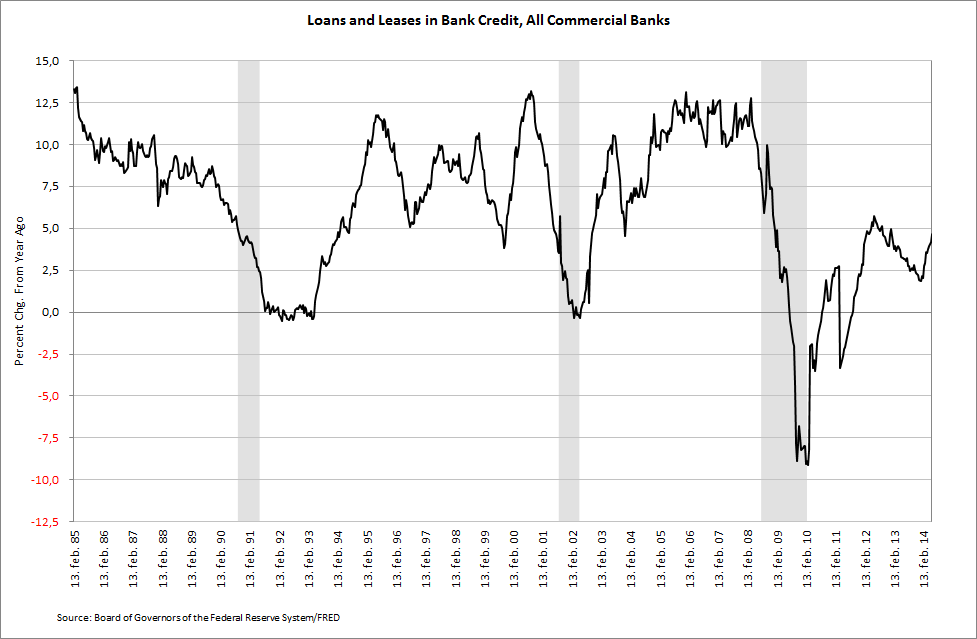
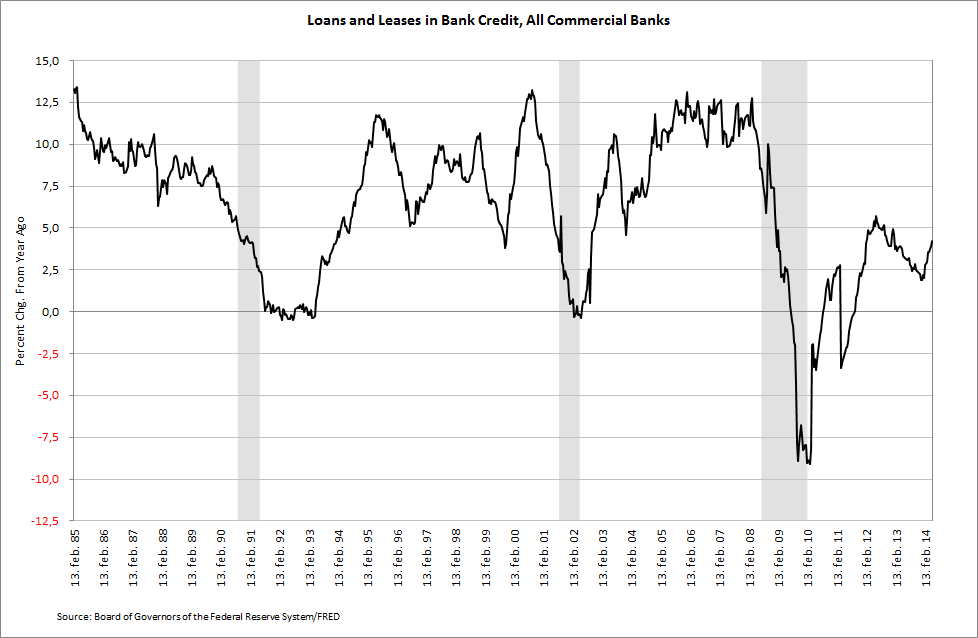
At the end of last year, the year on year growth rate in Bank Credit bottomed at just 1.1%. Excluding certain periods during 2009 and 2010, this was the lowest growth rate ever reported based on data going back to 1985 and was even lower than the troughs from August 1991 and and March 2002. At about the same time (end of last year), the year on year growth rate in the monetary base peaked at 39.4%.

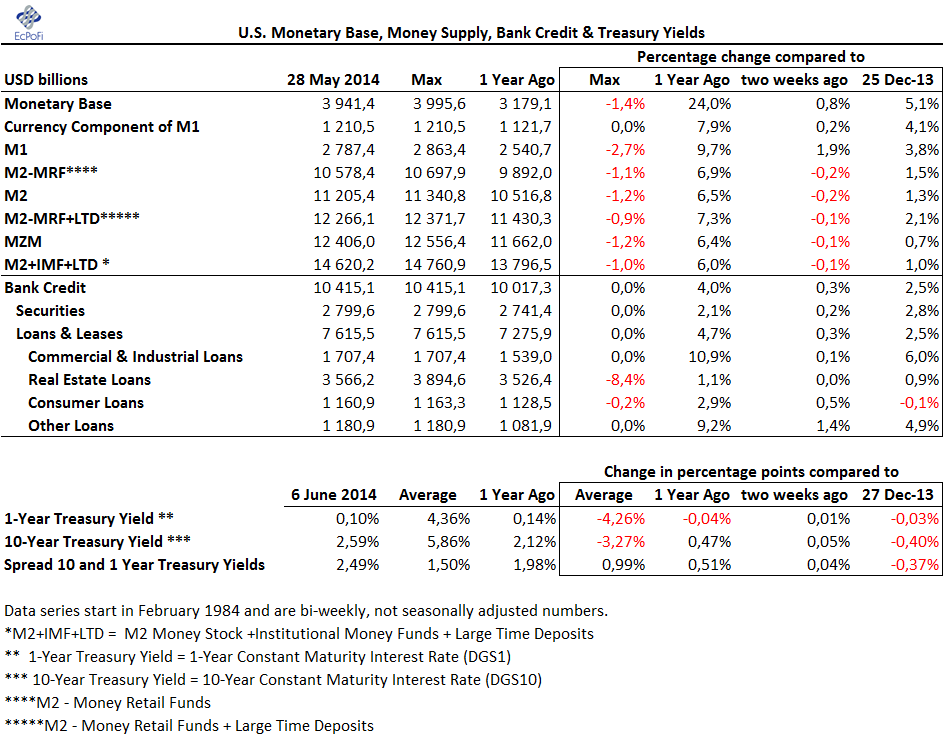
On 20 December last year I wrote that the Fed taper would put more pressure on banks to take on the role as being the primary driver of money supply growth (here). It now appears that banks are indeed taking on this role, once again, as bank credit for the bi-weekly period ending 28 May increased 4.0% on last year. This was the highest growth rate since the end of June last year. Since hitting 4.9% at the beginning of this year, the M2 money supply growth rate on last year has now increased to 6.5%.


Meanwhile, the monetary base growth rate has now dropped to 24.0% on the same basis, the lowest since July last year.


Bank Credit consists of two items; Securities and Loans & Leases. As of 28 May, Securities made up 26.9% of Bank Credit while Loans & Leases made up the rest, or 73.1%. During the last year, increases in Loans & Leases has been the primary driver of Bank Credit growth as it increased 4.7%. During the same period, Securities only increased 2.1%.


U.S. banks' expansion of Loans & Leases is therefore increasingly fueling Bank Credit and money supply growth.

Digging a bit further, Loans & Leases consists of four subcategories; Commercial & Industrial Loans, Real Estate Loans, Consumer Loans and Other Loans & Leases. Of these four, the first made up 49.6%, the largest share, of the growth in Loans & Leases during the last year. Other Loans & Leases made up 29.2% of this growth, while Real Estate Loans and Consumer Loans made up 11.7% and 9.6%, respectively, of the total growth. This is in stark contrast to the run-up to the banking crisis when Real Estate Loans and Commercial & Industrial Loans on average made up 52.5% and 27.9%, respectively, of the growth in Loans & Leases for the three year period culminating in the collapse of Lehman Brothers in mid September 2008. Today, this corresponding average for Real Estate Loans is a negative 10.9% of the growth in Loans & Leases during the last three years while Commercial & Industrial Loans made up 59.0%. The granting of loans by U.S. commercial banks has therefore certainly shifted to a large extent in the U.S. away from real estate loans and into commercial and industrial sector. The latter is now growing significantly and is once again, which is rather rare, expanding at more than 10% on a year on year basis.


As a result, Commercial & Industrial Loans outstanding is at an all-time high, 12.4% higher than September 2008.


What does all this mean? Firstly, it shows that banks increasingly are indeed taking over the role as the driver of money supply growth, at least for now. If banks didn't take on this role and expand credit, the money supply growth would slow down significantly and even contract, sending the economy and financial markets into turmoil. This reaction might be postponed a bit longer as banks expand credit. Eventually the significant monetary expansion seen in recent years will come to an end either through price inflation getting out of hand or when banks eventually run out of reserves (which could take a long time depending on the pace in credit growth). Secondly, the data shows that an increasingly bigger share of the newly issued money is now being injected into the commercial and industrial sector, potentially creating new bubbles and fueling old ones in those relevant sectors receiving this new money first.

*****

Summary monetary and treasury yield data for the bi-weekly period ending 28 May 2014 (treasury yields as of 6 June 2014):


Tuesday, 27 May 2014

U.S. Money, Credit & Treasuries Review (as of 14 May 2014)

As of this month, the Federal Reserve has cut its monthly asset purchases to USD 45 billion from USD 85 billion a month last year. To avoid the house of cards built on ever increasing quantities of money, the ball is increasingly being passed to banks to increase the money supply. By the looks of things, banks are responding and expanding their loan portfolios in tandem with the Fed tapering. Since peaking at 39.4% at the end of last year, the year on year growth rate in the monetary base has fallen sharply to the current 26.5%. Given current Fed policy, the base will continue to grow at an ever slower pace in the coming weeks and months. 


Since the end of last year, the M2 money supply has increased USD 158.8 billion. During the same period, the Loans & Leases portfolio of U.S. commercial banks increased USD 159.2 billion. Changes in money supply are not easily reconcilable, but this development suggests banks are once again playing a bigger role in creating new money. Loans & Leases have now increased 2.1% this year and 4.2% compared to the same week last year - the biggest year on year increase since the bi-weekly period ending 23 January 2013. 


The driver of the growth in Loans & Leases this year is a rapid expansion in Commercial & Industrial Loans, making up 61.0% of the total growth. The rest of the growth in Loans & Leases is made up of Real Estate Loans (18.6% of the growth), Consumer Loans (a negative 3.6% of the growth) and Other Loans (24.1% of the growth). Compared to the same period last year, Commercial & Industrial Loans expanded 11.1%, the biggest increase since March last year and 2.35 times higher than the average year on year growth rate of 4.7% since 1985.


In short, the issuance of Commercial & Industrial Loans are once again booming and are now 6.0% higher than the peak from October 2008 and 42.7% than the trough from July 2010. 


With U.S. banks holding more than USD 2.7 trillion in cash (most of which is excess cash), there is virtually no limit to how much credit banks can create given the low reserve requirements. Other factors, such as the demand for loans and banks' lending standards, will therefore determine the extent of the growth in bank lending going forward. 


The M2 money supply expanded 6.3% for the week compared to the same period last year. The average year on year growth rate this year, currently at 6.0%, remains significantly lower than the 6.8% average last year and the 8.6% average in 2012. The growth rate has picked up though since hitting 4.9% in early January. Since bottoming at 1.1% at the end of last year, the year on year growth rate in Bank Credit has picked up ending on 3.5% for the bi-weekly period ending 14 May. This growth was driven by the increase in Loans & Leases discussed above. 


The 10-year U.S. treasury yield dropped eight basis points for the bi-weekly period ending 23 May, while the 1-year yield fell one basis point. Year to date, the 10-year yield has shred a full 45 basis points, but is 55 basis points higher than at this stage last year. The spread between the two remains high in a historical perspective. 


Key monetary statistics for the bi-weekly period ending 14 May 2014 (23 May for treasury yields): 


Monday, 12 May 2014

U.S. Money, Credit & Treasuries Review (as of 30 April 2014)

The U.S. monetary base declined USD 80 billion on two weeks ago to end April on USD 3.9155 trillion. As the effects of the higher monetary base compared to last year and Fed tapering their asset purchases, the growth rate in the base is now rapidly declining: at the end of December last year, the base expanded 39.4%, at the end of April this has now fallen a full 10 percentage points to 29.4%. This trend will continue going forward as well, but at an even quicker pace as asset purchases have now been reduced from USD 85 billion a month in December last year to USD 45 billion starting this month.


Future monetary inflation is therefore increasingly becoming dependent on banks expanding their balance sheets. I have now therefore added a more detailed overview of bank assets to monitor developments going forward. These will be discussed below.

The M2 money supply growth rate on a year ago increased from 6.08% two weeks ago to 6.54%, the highest reported since October last year. The growth rate in Bank Credit also picked up and at 3.07% was the highest growth rate compared to the same week last year since July 2013. It still however remains more than half as low as the long term average of 6.41%.


Compared to a year ago, Bank Credit expanded USD 308.7 billion (USD 25.7 billion a month). Of this growth, Loans & Leases made up USD 285.7, or 92.6%, while increases in the holding of Securities made up the rest, or 7.4%. Increases in Commercial & Industrial Loans made up 56.3% of the growth in Loans & Leases, while growth Other Loans made up 23.6%. The rest was made up of increases in Real Estate Loans and Consumer Loans.

The growth in Commercial & Industrial Loans has picked up some serious pace in recent months. At 10.45%, the current year on year growth rate is the the highest it's been for a year leading to an increase of USD 160.9 billion in loans outstanding over the last year. This should be welcomed news for those complaining about banks not lending to businesses.


The 10-year treasury yield declined 9 basis points on two weeks ago and is now down 37 basis points since 27 December last year. The spread between the 1- and the 10-year yield has now narrowed 37 basis points since 27 December.


The tables below summarise some of the key developments in the monetary statistics.


Monday, 28 April 2014

U.S. Money, Credit & Treasuries Review (as of 16 April 2014)

The U.S. monetary base is now just USD 4.41 billion short of hitting the USD 4 trillion mark the most recent bi-weekly monetary stats released by the Fed shows. Since 25 December last year, the base has now increased USD 244.65 billion, or 6.52%. 

Here's a quick reminder of just how significant the expansion in the base have been during the last six years and counting: at the beginning of 2000, the base stood at USD 646.86 billion. At the beginning of 2008, the base had increased 33.97% to USD 866.63 billion. Today, the base is USD 3.9956 trillion, having increased 361.05% since the beginning of 2008!


As the Fed is tapering, and as the denominator is larger, the growth rate in the monetary base is now slowing fairly rapidly. Today the growth rate on the same period last year is 31.03%, a 8.36 percentage point (or 21.21%) decrease compared to the 39.39% year on year (YoY) growth rate at the end of last year. 


As I keep pointing out in the various money supply reports, U.S. banks now need to step in and increase bank credit (which consists predominantly of loans & leases and securities) to avoid a significant drop in the money supply growth rate. If they don't, and if the Fed doesn't again increase its asset purchases, then the negative effects of prior monetary inflation will become obvious for all to see, first and foremost through a large drop in stock market prices (and many other asset prices). Do note that I am not advocating further money supply growth. If anything, I'm advocating an unchanging money supply as monetary inflation does not increase prosperity (in fact, it does the opposite). 

*****

The YoY growth rate in M2 money supply came in at 6.08% for the bi-weekly period ending 16 April. This was lower than both the 52-week moving average of 6.39% and the 6.81% average for 2013. It has however picked up pace since hitting an intermediate trough at 4.94% at the beginning of this year. 

Since hitting 1.14% at the end of last year, the Bank Credit YoY growth rate has since increased to the current 2.87%. This growth rate is however extremely low, and rare, in a historical perspective: since 1985 it has averaged 6.42%. Removing the period since 2009, this average increases to 7.39% as the average since 2009 was only 2.00%. 


The increase in the growth rate of Bank Credit this year has been driven by an increase in Loans & Leases, an item that currently makes up about 73% of bank credit (average since 1985 is 74.79%). Since hitting 1.86% at the beginning of the year, the Loans & Leases growth rate has since increased to the current 3.74%, indicating that the demand and/or supply of loanable funds has increased. 


The 1- and 10-year treasury yields increased one and four basis points respectively on two weeks ago. Compared to one year ago, the 1-year yield is down one basis point while the 10-year yield is up 99 basis points. The spread between the two, currently at 2.61 percentage point, is therefore currently 100 basis points higher than a year ago. This spread, though not unusual since the end of 2008, is high in a historical perspective driven by the ultra low 1-year yield  - since 1985 it has averaged 150 basis points.  


The tables below summarise the most recent monetary and treasury yield data discussed in this report.