If in the course of our investigation, it is possible to prove that the rate of interest charged by the banks to their borrowers is not promptly adjusted to all changes in the economic data (as it would be if the volume of money in circulation were constant)— either because the supply of bank credit is, within certain limits, fundamentally independent of changes in the supply of savings, or because the banks have no particular interest in keeping the supply of bank credit in equilibrium with the supply of savings and because it is, in any case, impossible for them to do so—then we shall have proved that, under the existing credit organization, monetary fluctuations must inevitably occur and must represent an immanent feature of our economic system—a feature deserving of the closest examination.
Prices and Production, Friedrich A. Hayek
U.S. Money, Credit & Treasuries Review (as of 28 May 2014)
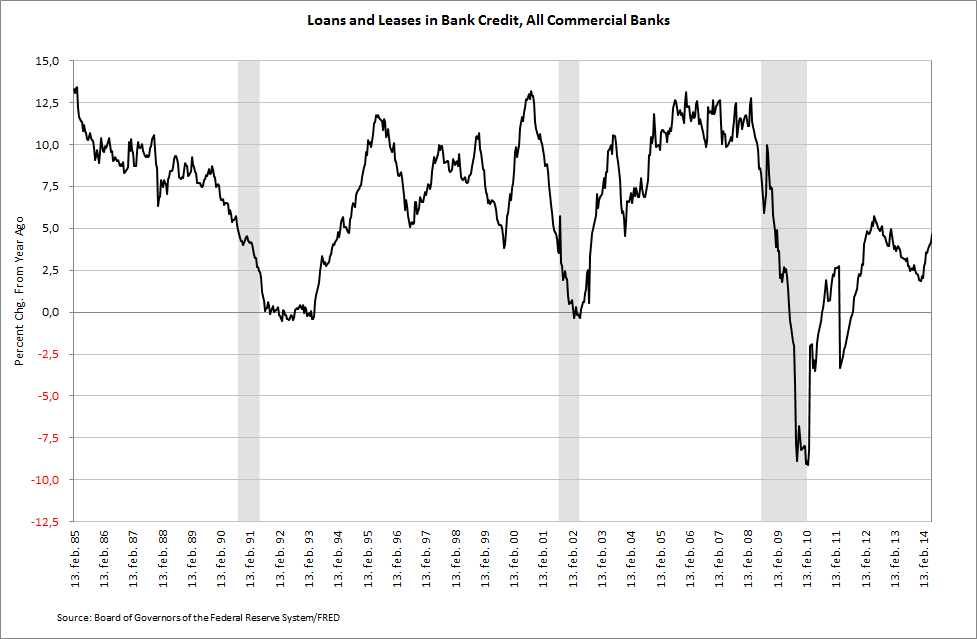
At the end of last year, the year on year growth rate in Bank Credit bottomed at just 1.1%. Excluding certain periods during 2009 and 2010, this was the lowest growth rate ever reported based on data going back to 1985 and was even lower than the troughs from August 1991 and and March 2002. At about the same time (end of last year), the year on year growth rate in the monetary base peaked at 39.4%.
On 20 December last year I wrote that the Fed taper would put more pressure on banks to take on the role as being the primary driver of money supply growth (here). It now appears that banks are indeed taking on this role, once again, as bank credit for the bi-weekly period ending 28 May increased 4.0% on last year. This was the highest growth rate since the end of June last year. Since hitting 4.9% at the beginning of this year, the M2 money supply growth rate on last year has now increased to 6.5%.
Meanwhile, the monetary base growth rate has now dropped to 24.0% on the same basis, the lowest since July last year.
Bank Credit consists of two items; Securities and Loans & Leases. As of 28 May, Securities made up 26.9% of Bank Credit while Loans & Leases made up the rest, or 73.1%. During the last year, increases in Loans & Leases has been the primary driver of Bank Credit growth as it increased 4.7%. During the same period, Securities only increased 2.1%.
U.S. banks' expansion of Loans & Leases is therefore increasingly fueling Bank Credit and money supply growth.
Digging a bit further, Loans & Leases consists of four subcategories; Commercial & Industrial Loans, Real Estate Loans, Consumer Loans and Other Loans & Leases. Of these four, the first made up 49.6%, the largest share, of the growth in Loans & Leases during the last year. Other Loans & Leases made up 29.2% of this growth, while Real Estate Loans and Consumer Loans made up 11.7% and 9.6%, respectively, of the total growth. This is in stark contrast to the run-up to the banking crisis when Real Estate Loans and Commercial & Industrial Loans on average made up 52.5% and 27.9%, respectively, of the growth in Loans & Leases for the three year period culminating in the collapse of Lehman Brothers in mid September 2008. Today, this corresponding average for Real Estate Loans is a negative 10.9% of the growth in Loans & Leases during the last three years while Commercial & Industrial Loans made up 59.0%. The granting of loans by U.S. commercial banks has therefore certainly shifted to a large extent in the U.S. away from real estate loans and into commercial and industrial sector. The latter is now growing significantly and is once again, which is rather rare, expanding at more than 10% on a year on year basis.
As a result, Commercial & Industrial Loans outstanding is at an all-time high, 12.4% higher than September 2008.
What does all this mean? Firstly, it shows that banks increasingly are indeed taking over the role as the driver of money supply growth, at least for now. If banks didn't take on this role and expand credit, the money supply growth would slow down significantly and even contract, sending the economy and financial markets into turmoil. This reaction might be postponed a bit longer as banks expand credit. Eventually the significant monetary expansion seen in recent years will come to an end either through price inflation getting out of hand or when banks eventually run out of reserves (which could take a long time depending on the pace in credit growth). Secondly, the data shows that an increasingly bigger share of the newly issued money is now being injected into the commercial and industrial sector, potentially creating new bubbles and fueling old ones in those relevant sectors receiving this new money first.
*****
Summary monetary and treasury yield data for the bi-weekly period ending 28 May 2014 (treasury yields as of 6 June 2014):


